

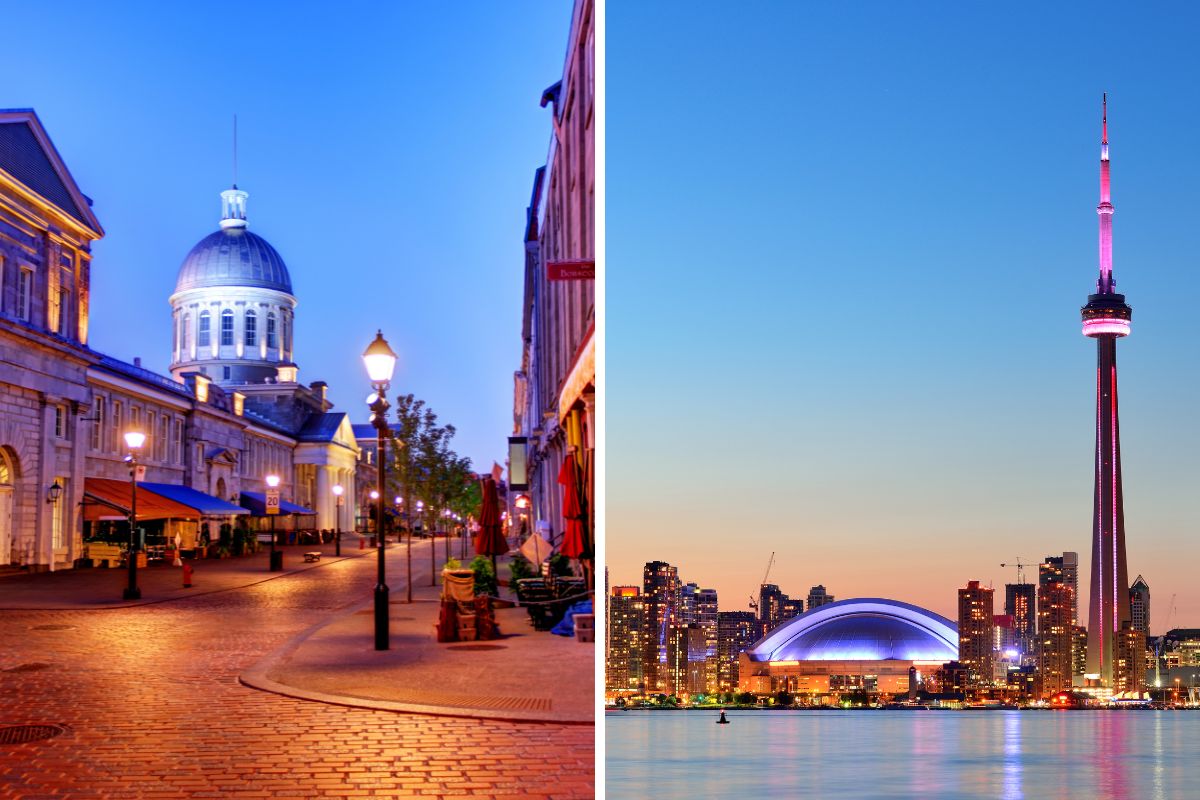
Montréal and Toronto both rank among the best places to live in Canada. Young professionals can find employment, culture, and safety in the world-class city of Toronto, while students, seniors, and families flock to Montréal for affordable housing, transportation, and education.
Key Takeaways
- Based on the abundance of employment, safety, healthcare infrastructure, and green space, it’s slightly better to live in Toronto than Montréal.
- Montréal offers more affordable housing, transportation, and post-secondary education.
- Toronto provides more income, safety, and healthcare in a location with milder weather.
- Montréal may appeal more to students, seniors, and low-income families, but professionals and artists will find greater opportunities in Toronto.
Never miss an amazing deal again + get our bonus 250+ page eBook for FREE. Join 50,000 other Canadians who receive our weekly newsletter – learn more.
Ranking the best place to live
We settled the debate between Montréal and Toronto by comparing up to 7 data points for each city in 8 categories:
- Affordability
- Employment
- Transportation
- Safety
- Health
- Environment
- Education
- Culture
Because the "best" is always a matter of personal preference, we ordered the categories from most to least objective. If the numbers don’t help you make up your mind by the time you reach the end of the list, perhaps the “vibe” of each city will.
Montréal vs. Toronto
Nearly 4.3 million strong in 2021, the population of the Montréal metropolitan area makes it the largest city in Québec and the second largest city in the country. Since its founding in 1642, 56.4% have become bilingual, although 33.8% remain strictly Francophone.
The largest metropolitan area in Canada is, of course, Toronto, with a total of 6.2 million living in the GTA in 2021. Despite having grown into a multicultural, international business centre since its founding in 1793, it remains stubbornly monolingual, with 88% of the population speaking just English.
Between the two, Montréal has a higher percentage of youth below 14, elders above 65, and people 15+ living in single-person households. Both cities have a sizable population of single adults, although Toronto is more diverse, with 57% of citizens belonging to a visible minority.
But that’s all surface stuff – to get a taste of what it’s like to live in each city, we’ve got to dig deep and compare affordability, employment, transportation, safety, health, environment, education, and culture.
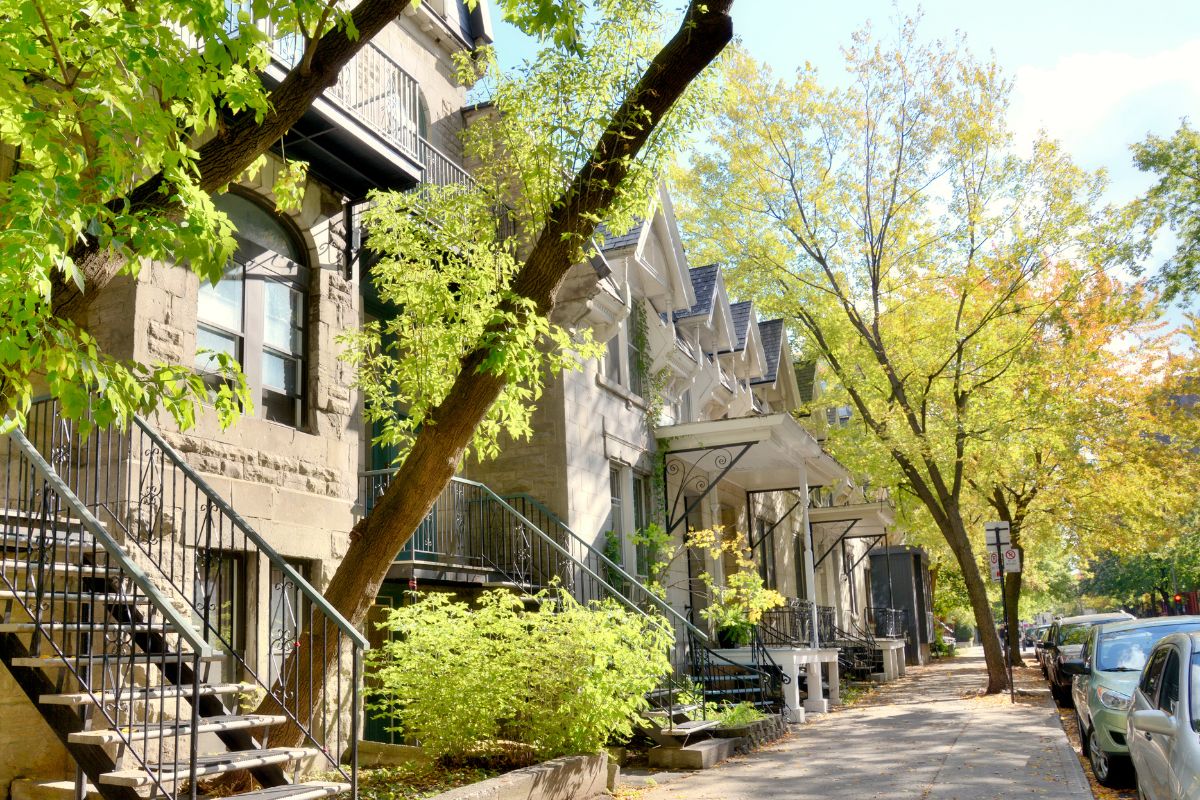
Affordability: Montréal
| Affordability indicators | Montréal | Toronto |
|---|---|---|
| Average house price (October 2024) | $544,300 | $1,060,300 |
| Average monthly cost to own (2021) | $1,420 | $2,108 |
| Average monthly cost to rent (2021) | $981 | $1,618 |
| Cost of living (compared to national average) | + 14% | + 30% |
| Cost of living (compared to provincial average) | + 22% | + 24% |
Everyone knows Toronto is one of the most expensive cities in Canada, but the numbers put everything in stark relief. More than 16% of households in Toronto live in housing requiring major repairs, more space, or lower rent to be considered "suitable," compared to 7.9% in Montréal.
According to the Victoria Transport Policy Institute, Montréal’s housing costs 20% – 40% less than peer cities such as Toronto and Vancouver. The secret to its success lies in its iconic, compact housing; 41.3% of households live in apartments less than 5 stories tall, which costs 20% – 50% less to build per square meter than a detached, single-family home.
Did you know? The average sale price of a house is 3.5 times higher in Toronto than in Sault Ste. Marie, the cheapest place to live in Ontario.
Employment: Toronto

| Employment indicators | Montréal | Toronto |
|---|---|---|
| Minimum wage (2024) | $15.75 | $17.20 |
| Average yearly salary (2024) | $68,792 | $74,178 |
| Average hourly pay (2024) | $33 | $36 |
| Unemployment rate (2021) | 8.4% | 13.3% |
| Inequality index (2020) | 0.35* | 0.39* |
* The GINI Inequality Index uses 0 to signify perfect equality and 1 to signify perfect inequality.
People in the 6ix make more money, taking home a median of $85,000 after tax – although, given the high cost of living, you have to wonder if it's enough. About 17.2% of seniors over 65 participate in Toronto’s labour market, compared to 14.8% in Montréal.
Still, according to the Blueground housing company, Toronto ranks 14th among 75 international cities for excellent work-life balance. It scores high on liveability and low on overworked indicators. On average, just 8.2% of Torontonians working full-time clocked over 48 hours per week.
Transportation: Montréal

| Transportation indicators | Montréal | Toronto |
|---|---|---|
| Walk score | 65 | 61 |
| Transit score | 67 | 78 |
| Bike score | 73 | 61 |
| Average yearly car insurance rate (2022) | $2,224 | $3,792 |
| Average commute duration in minutes (2021) | 27 | 30 |
| Average time in minutes needed to drive 10 km during rush hour (2023) | 19 | 29 |
Toronto has an excellent public transportation network but the compactness of Montréal’s neighbourhoods invites more people to use active transportation. The city boasts 870 km of bike lanes and ranked 103rd in the 2023 TomTom World Traffic Index; Toronto came in 3rd place.
The Société de Transport Montréal (STM) provides over 160 bus lines, 68 metro stations, 6 river shuttles, and connections to VIA Rail and the Montréal-Trudeau International Airport (YUL). About 87.5% of Montréal’s population lives within 500 metres of a public transport stop.
Safety: Toronto
 Image credit: Felix MacLeod, Unsplash
| Safety indicators | Montréal | Toronto |
|---|---|---|
| Crime Severity Index (CSI) (2023) | 63.2 | 58.54 |
| 5-year average change to CSI | +7.6% | +2.6% |
| Property crimes | 2,233.5 | 2,827.1 |
| Motor vehicle thefts | 401.0 | 422.7 |
| Criminal Code traffic violations | 388.6 | 174.2 |
| Violent Criminal Code violations | 1,217.9 | 985.6 |
| Homicides | 1.2 | 1.7 |
| Drug trafficking, production, and distribution violations | 27.3 | 25.9 |
| Hate crimes | 10.6 | 17.8 |
All crime statistics reflect the rate per 100,000 city residents in 2023.
Neither Montréal nor Toronto ranked highly on our list of the most dangerous cities in Canada. That said, in 2023, Toronto experienced relatively more property crimes, motor vehicle thefts, homicides, and hate crimes, while Montréal saw more violence, drug violations, and plain bad driving.
The latest Crime Severity Index (CSI) – which reflects both the frequency and severity of crimes committed – stands at 63.2 for Montréal and 58.5 for Toronto. While both cities are known hotbeds for mafia-style crime families and outlaw motorcycle gangs, we’re giving the crown to the relatively safer 6ix.
Health: Toronto
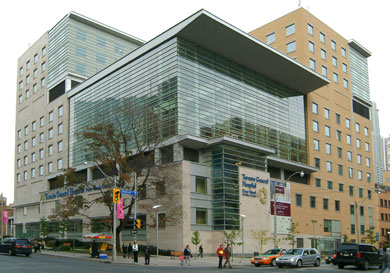 Image credit: University Health Network
| Health indicators | Montréal | Toronto |
|---|---|---|
| Nurses per 10,000 people (2021) | 165 | 181 |
| Family physicians per 10,000 people (2021) | 14 | 20 |
| Residents with a regular healthcare provider (2021) | 75.4% | 90.4% |
| Residents (12+) who perceived "most days" as very stressful (2021) | 24.2% | 20.7% |
Perhaps owing to the shortage of nurses and physicians, Montréalers are more stressed than Torontonians. The recent introduction of Bill 96 – which prevents healthcare workers from communicating in a language other than French except in "emergencies" – has not helped matters. Meanwhile, Torontonians can access free language interpretation services through the Health Services Department simply by dialling 311.
Environment: Toronto

| Environment indicators | Montréal | Toronto |
|---|---|---|
| PM 2.5 Air Quality Index (2017 - 2023) | 11.1* | 10.8* |
| Average temperature in January (2000 – 2024) | * Low -11 * High -4 | * Low -7 * High -1 |
| Average temperature in July (2000 – 2024) | * Low 18 * High 27 | * Low 17 * High 26 |
| Average snow in January | 35 cm | 18 cm |
| Average rain in July | 97 mm | 135 mm |
| Parkland as a percentage of city land (2023) | 1.8% | 12.8% |
* Lower scores indicate higher air quality.
Montréal and Toronto both have their charms. It’s purely a matter of taste whether you prefer the cobblestone streets of Old Montréal to the industrial-chic vibe of the Distillery District, or the hip and queer-friendly Village and Quarter Latin to the lively walkable Danforth.
What’s not up for debate is the 6ix’s higher air quality, milder weather, and greater amount of green space. Toronto manages a total of 8,086 public parks and you’re less likely to freeze in winter thanks to the warming effect of Lake Ontario.
Education: Montréal
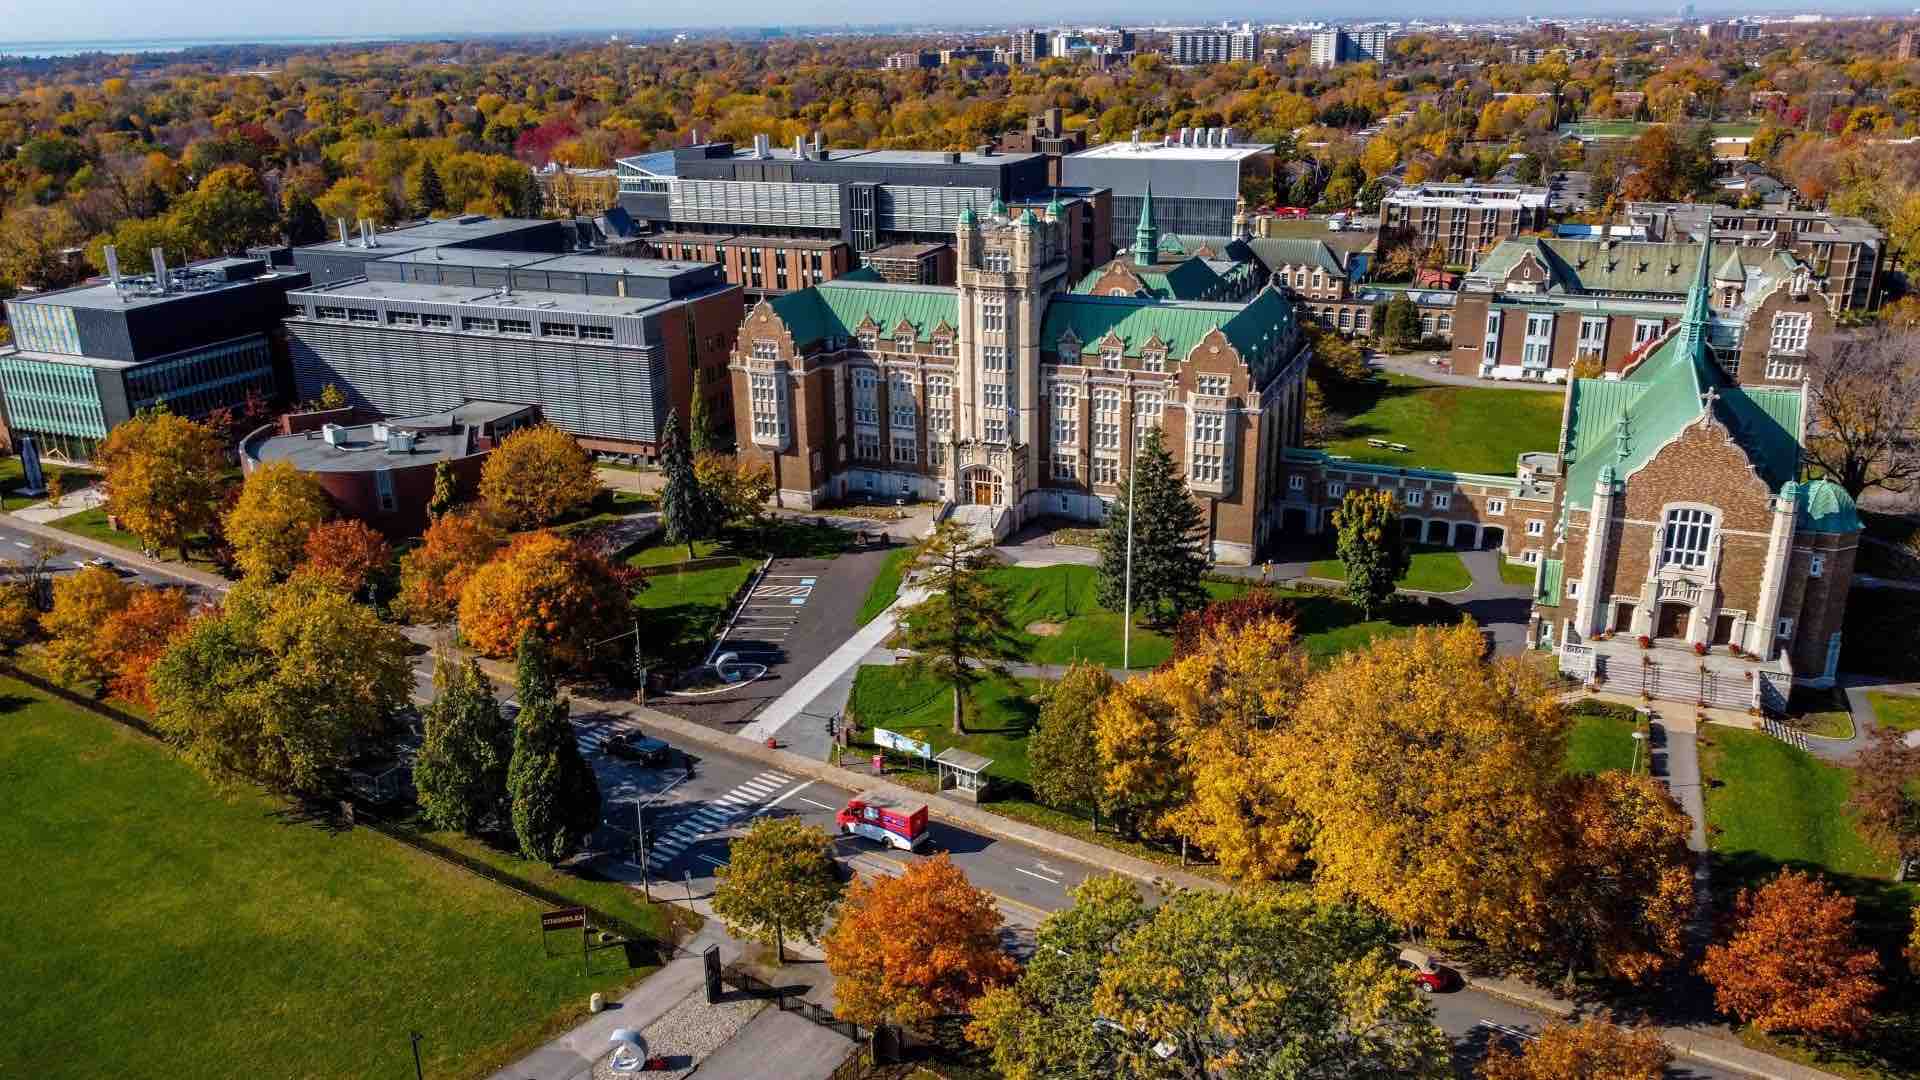 Image credit: Concordia University
| Education indicators | Montréal | Toronto |
|---|---|---|
| Youth (18–24) attending post-secondary (2021) | 64.2% | 57.2% |
| Average undergraduate tuition fees (2023–2024) | $3,754 | $8,095 |
| Maclean’s Best University 2023 (by quality) | McGill University (1st place) | University of Toronto (2nd place) |
| Maclean’s Best University 2023 (by reputation) | McGill University (4th place) | University of Toronto (1st place) |
| Maclean’s Best University 2023 (by student-to-faculty ratio) | Université du Québec à Montréal (23.6:1) | Toronto Metropolitan University (30.9:1) |
| Maclean’s Best University 2023 (operating expenses devoted to scholarships and bursaries) | Concordia University (8.6%) | York University (12.8%) |
We should really call this section "Post-Secondary Education." Thanks to the multitude of school boards operating in each city, it’s hard to find overall statistics on the state of primary, elementary, and secondary schools.
While there are plenty of cool student hangouts in each city, Montréal has the edge due to its affordability (both for living expenses and tuition fees). To qualify for the lowest rates, you must be considered a resident of Québec by birth, marriage, or residence, among other things.
And yes, you can study in English.
Culture: Toronto
 Image credit: Mirvish
| Culture indicators | Québec | Ontario |
|---|---|---|
| Cultural Gross Domestic Product (GDP) as a percentage of the provincial total (2022) | 2.5% | 2.7% |
| Jobs in culture (2022) | 153,068 | 270,528 |
| Net investment in culture per capita (2009) | $55 | $19 |
| Net investment in libraries per capita (2009) | $69 | $43 |
| Consumer spending on cultural goods and services (2008) | $722 | $868 |
As you can tell by the age and scarcity of statistics, it’s hard to crown a culture capital using hard data. You’ll have more luck (and more fun) if you pay an in-person visit to Mont Royal, the Museum of Fine Arts, and Saint Joseph’s Oratory in Montréal, or the CN Tower, the Art Gallery of Ontario, and the Royal Ontario Museum in Toronto.
On one hand, Condé Nast readers awarded Montréal 9th place on the list of "Best Big Cities" with no mention of Toronto. On the other, Toronto boasts 13 Michelin 1 and 2-star establishments, while Montréal has none.
For a greater share of cultural jobs and events, we’re giving the crown (narrowly) to Toronto.
The winner: Toronto
Scooping 5 of 8 categories, Toronto is the better place to live. Although we ranked Montréal higher on our other list, the addition of 3 other categories saw Toronto take the crown in:
- Employment
- Safety
- Health
- Environment
- Culture
That said, the best litmus test for a new city remains your priorities. Montréal may be more to your liking if you prefer a city with excellent:
- Affordability
- Transportation
- Education
Ultimately, Toronto is best suited to affluent professionals. It has world-class economic opportunities, health care, and all the excitement you’d expect from a vibrant, multicultural metropolis – for a price. If you make a low-to-moderate income and prefer a modest lifestyle, Montréal’s blend of bohemian and community-oriented living may offer more satisfaction.
Methodology
We added 3 categories to the list of criteria we used to decide "The Best Places to Live in Canada" for a total of 8. To supply the data points in each category, we chose reputable sources that applied a standardized metric to each city within a single time period.
From most to least used, we consulted:
- Statistics Canada
- The Economic Research Institute (ERI)
With additional input from:
- The Canadian Real Estate Association (CREA)
- Walk Score
- The Canadian Institute for Health Information (CIHI)
- Tourisme Montréal
- Destination Toronto
- The Canada Council for the Arts
What the locals say
Looking at the data is all well and good, but it’s also handy to read reviews from people who actually live in these cities. Sure, they might be a little biased, but these comments from Redditors can give you unique perspectives that data just doesn’t capture.
We’ll start with one of the biggest issues: language. Many Redditors jumped in to say that you should only be prepared to move to Montreal if you have some experience with French. If you don’t speak the language, you may miss out on job opportunities or the chance to truly understand the culture.

Another issue Redditors raised is the vibe of each city, with people suggesting Montreal is more laid back compared to Toronto, which they described as fast-paced and more stressful.

(They also highlighted the old-world European charm many other people also mentioned).

Redditors overwhelmingly pointed out Toronto’s diversity and opportunities for young people. The faster pace of life in Toronto might make it a better choice for someone looking for work rather than settling down.
FAQ
Does Montréal or Toronto have better food?
According to the Michelin guide, Toronto has better fine dining, but Montréal is more affordable. Both cities are surrounded by farmland and have access to imports via air, land, and water.
Is Toronto or Montréal bigger?
Toronto is bigger than Montréal; 6,202,225 people live in the metropolitan area and 3,025,647 in the city proper (as of 2021).
Is Montréal as expensive as Toronto?
Compared to the national average, the cost of living in Montréal is half as much as living in Toronto.
Is Montréal a friendly city?
Montréal has a mixed reputation for friendliness, with some visitors praising its warmth and hospitality and others finding the residents brusque and snotty.
Does Montréal or Toronto get more snow?
Montréal gets 209.5 cm of snow per year, while Toronto gets 121.5 cm.
creditcardGenius is the only tool that compares 126+ features of 251 Canadian credit cards using math-based ratings and rankings that respond to your needs, instantly. Take our quiz and see which of Canada's 251 cards is for you.


 GC:
GC: 


Comments
Leave a comment
Required fields are marked with *. Your email address will not be published.
Showing 6 comments